Part 2 – Bits & Pieces of Geometry
A large part of the previous issues I was having with implementing a tool like this in Excel is the fact you have to generate your own routines (or find suitable ones by others) for all the geometrical calculations required to assess a given section at any given angle of loading or neutral axis angle. Simple shapes is probably ok, but it get exponentially harder as things get more complex in terms of complex geometry, addition of holes or voids and other such stuff. It’s enough to make you question if Excel is the best tool for the job.
While there is plenty of examples out there in VBA, finding something that is optimised for your requirement, and then actually slotting it into your code can be a bugger. Based on the previous post in this series I’d already determined this project was going to be my chance to teach myself the inner workings of Python, goodbye Excel (for the code of this project anyway). I was hoping to link my final code into Excel using xlwings or similar, depending on how tedious it is to do a graphical user interface in Python (Excel is bad enough creating forms and events and it has a GUI in the VBE to get rid of some of the building aspects).
So for the task at hand you need a means of determining intersections of geometry, determining whether points lie within a section, the ability to do rotations & transformation of coordinates, and perform tasks like finding the centroid of arbitrary shapes. This all gets way out of hand real quick if you have to write your own routines, especially if you consider lumped on top of this geometrical stuff is the fact that across the section the stress is not linear in the case of the EC2 stress block (which is the ultimate goal of the whole exercise).
I initially started out down this route in Python, trying to generate my own routines based on examples found elsewhere, adding my own stuff in. But after some searching it became apparent that there are some pretty good packages dedicated to the manipulation of geometry in Python. So why reinvent the wheel, these packages are optimised for this sort of thing, my code didn’t stand a chance.
I’d point out at this point that I don’t plan on outlining stage by stage how I treated every aspect in terms of going over the exact code, more a general overview. Because if you are interested you’ll be able to go have a look at the source code and expose the inner workings once I’ve finished.
A lot of the ‘how do I do this in Python’ type questions on the net regarding geometry seemed to lead to a package called shapely. It offered all the bells and whistles I was after (and some). I just needed my code to interface with this package and the geometry objects it creates.
So I set about installing it and having a play, after a few days I got the hang of things, enlisting matplotlib to visualise whatever I was doing to the geometry to make sure things were behaving as expected.
At this stage I had some sub-modules that did various things like rotating the section, slicing it horizontally at points of interest, merging individual geometries making up a section, etc, but nothing tying them all together in any cohesive manner. Basically it was one huge list of code that was getting out of hand.
Shapely works on the principle of feeding in some raw coordinates, and it processes this into an object that the other shapely routines can work their magic on.
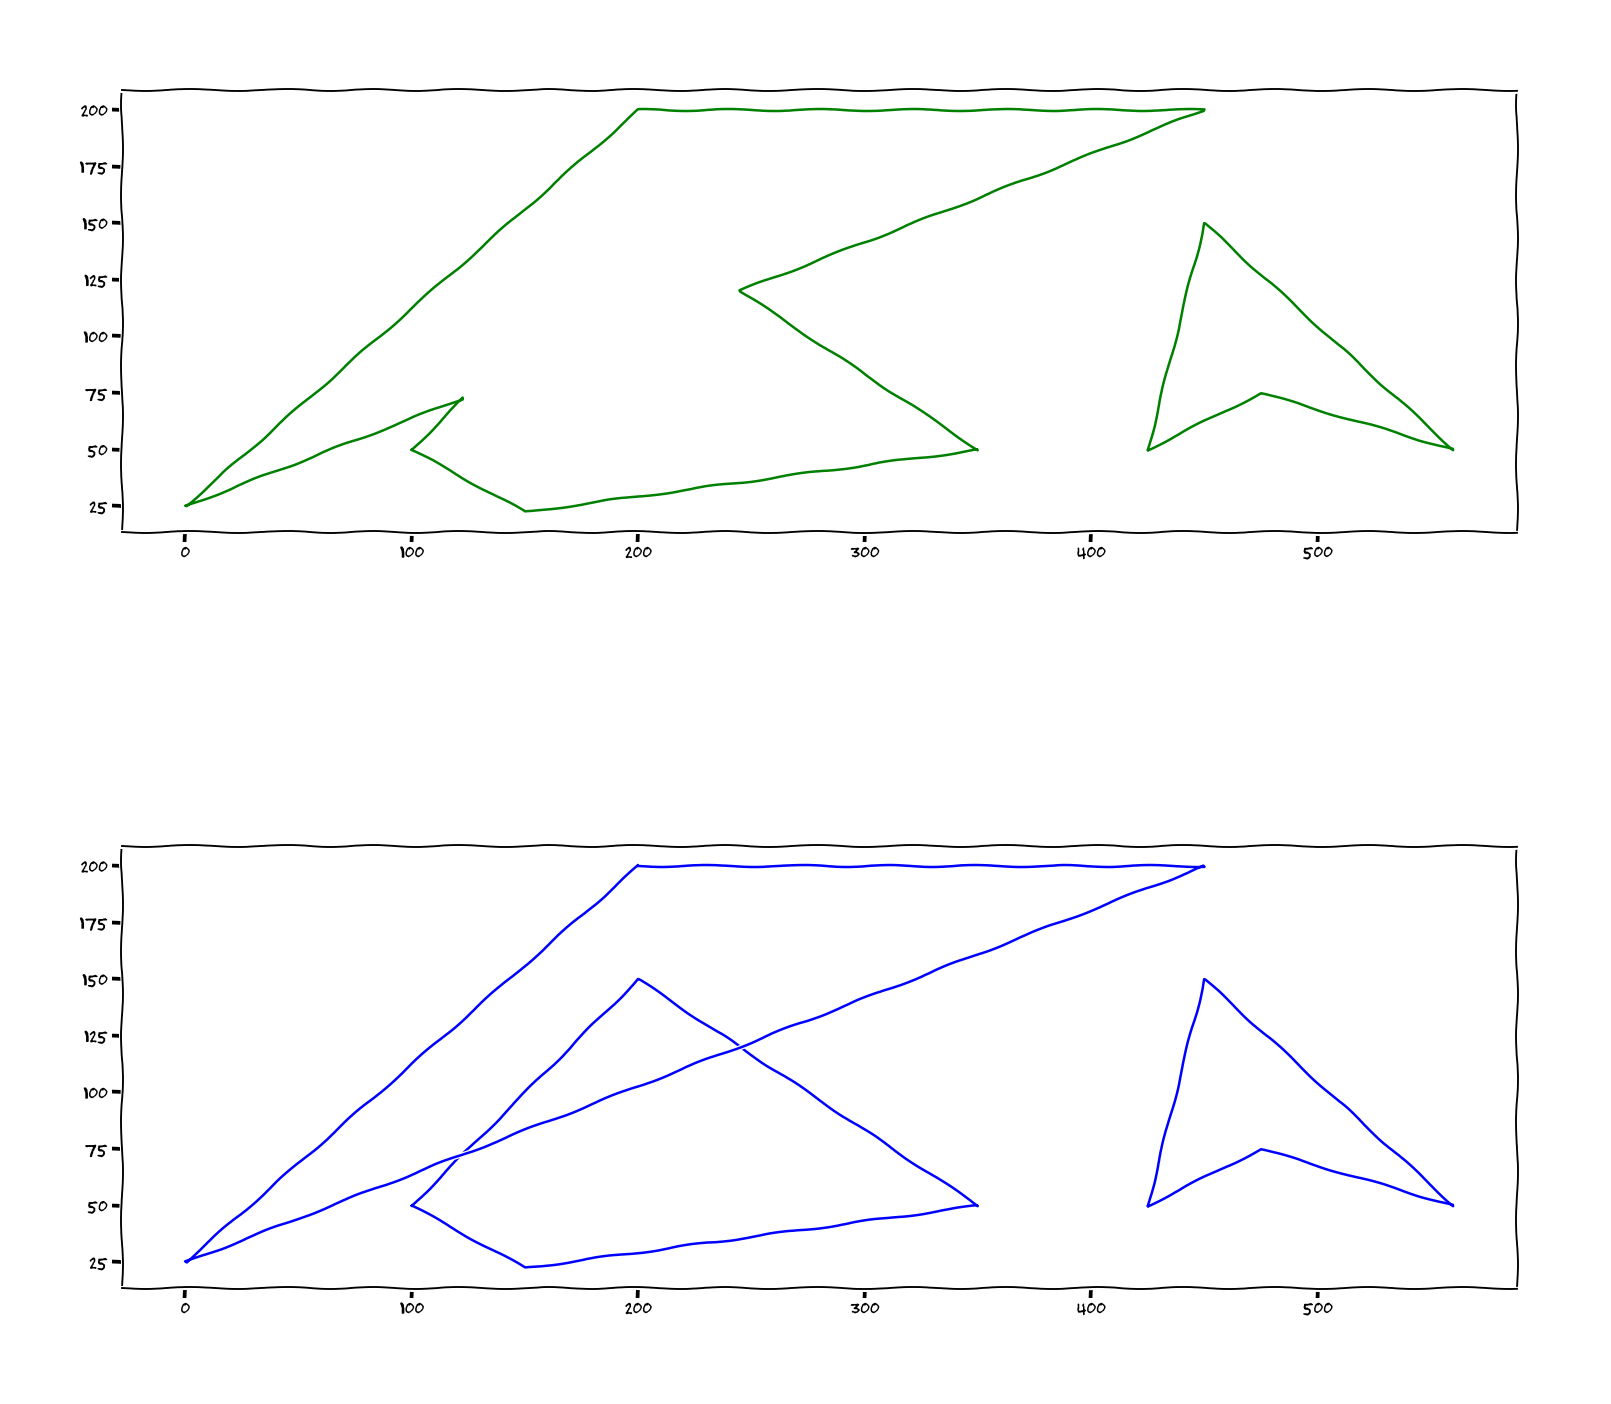
For example, the example above of the geometry created is based on the following defined geometry which the end user generates either manually or automatically as part of some other routine. It could be generated via a python function, or within Excel, etc.
Note the external section perimeter and the internal holes are defined as separate lists, shapely takes care of closing the loop depending on the type of geometry being generated for each list, refer to the shapely documentation to review what operations you can and cannot do with different types of geometry objects. Note that in terms of the inputs for this tool, multiple defined geometry items are simply lists of lists of x/y coordinate tuples. The following input is simply the elements shown in red above in the constituent geometry plot.
geometry = [[(x11, y11), (x12, y12), (x13, y13)....],
            [(x21, y21), (x22, y22), (x23, y23)....],
            [(x31, y31), (x32, y32), (x33, y33)....]]

geometry = list[[list], [list], [list]]
Firstly you’d need to import any functions you wanted to use from shapely, such as the following for the examples below:-
>>>from shapely.affinity import rotate, translate
>>>from shapely.geometry import Polygon
Then define some input geometry:-
# define some coordinates for the elements making up the external perimeter of the section, and internal holes
>>>ext_section_coords = [[(300, 400), (456, 234), (345, 234)], [(0, 0), (0, 256), (100, 100), (50, 300), (400, 50), (500, 300), (400, 200), (350, 275), (500, 467), (600, 0), (0, 0)]]

>>>int_holes_coords = [[(425, 50), (450, 150), (560, 50), (475, 75), (425, 25)], [(100, 50), (200, 150), (150, 25), (125, 30), (100, 50)], [(200, 50), (50, 50), (50, 25)]]
# note how this is 3 separate lists = 3 hole elements being defined
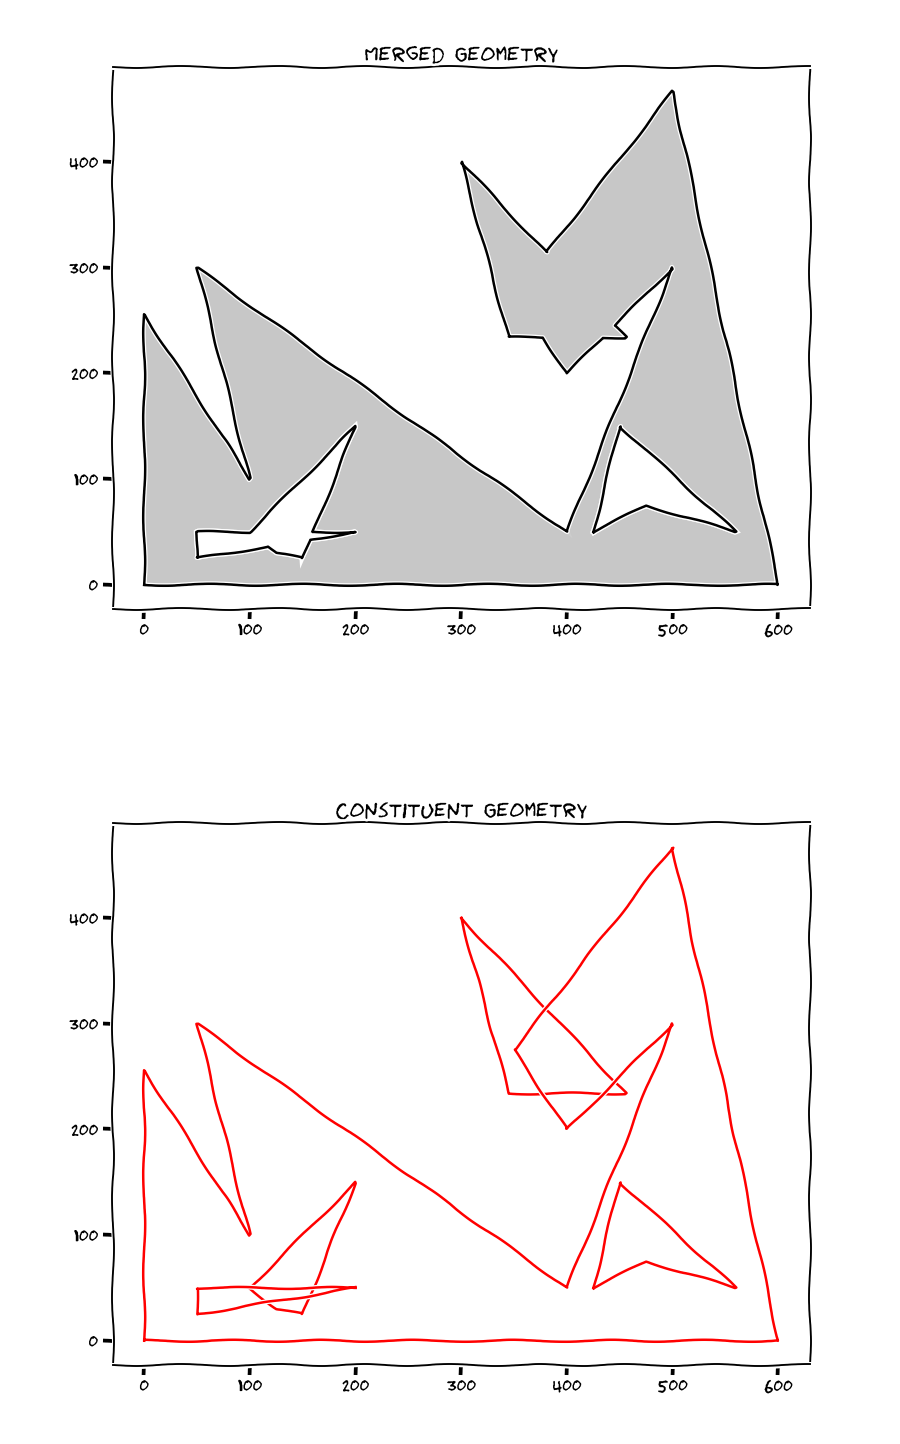
After some other intermediate processing within the code we end up with merged geometry as follows:-
>>>print(ext_section_merged)
[(0.0, 0.0), (0.0, 256.0), (100.0, 100.0), (50.0, 300.0), (400.0, 50.0), (500.0, 300.0), (445.3416149068323, 245.3416149068323), (456.0, 234.0), (434.0, 234.0), (400.0, 200.0), (377.3333333333333, 234.0), (345.0, 234.0), (300.0, 400.0), (380.62787136294025, 314.2036753445636), (500.0, 467.0), (600.0, 0.0), (0.0, 0.0)]

>>>print(int_holes_merged)
[[(425.0, 50.0), (450.0, 150.0), (560.0, 50.0), (475.0, 75.0), (425.0, 25.0), (425.0, 50.0)], [(160.0, 50.0), (200.0, 50.0), (157.14285714285714, 42.857142857142854), (150.0, 25.0), (125.0, 30.0), (117.24137931034483, 36.206896551724135), (50.0, 25.0), (50.0, 50.0), (100.0, 50.0), (200.0, 150.0), (160.0, 50.0)]]
# note how this is now 2 lists describing 2 holes, as 2 holes were merged into 1 hole.
The shapely Polygon function is feed a processed list of coordinates after they have been merged and checked to ensure holes are inside the perimeter and such things. The following Polygon object is created which is the mathematical representation of the merged geometry in the ‘merged geometry’ plot above:-
>>>base_section = Polygon(ext_section_merged, int_holes_merged)

>>>print(base_section)
POLYGON ((0 0, 0 256, 100 100, 50 300, 400 50, 500 300, 445.3416149068323 245.3416149068323, 456 234, 434 234, 400 200, 377.3333333333333 234, 345 234, 300 400, 380.6278713629403 314.2036753445636, 500 467, 600 0, 0 0), (425 50, 450 150, 560 50, 475 75, 425 25, 425 50), (160 50, 200 50, 157.1428571428571 42.85714285714285, 150 25, 125 30, 117.2413793103448 36.20689655172414, 50 25, 50 50, 100 50, 200 150, 160 50))

# this object is essentially read as:-
# Polygon ((external perimeter polygon), (internal hole 1 polygon), (internal hole 2 polygon), ....etc)
All the other shapely functions work on the principle of operating on these geometry objects, whether they be Points, LineStrings, Polygons, MultiPolygons or several other object types processed within shapely.
For example determining the centroid of the section defined above is as easy as:-
>>>centroid = base_section.centroid
>>>print(centroid)
POINT (312.8746560616833 154.6442710843835)
Determining the area of the section defined above is as simple as:-
>>>print(base_section.area)
122741.222970663
Determining a random point inside our base geometry if its rotated by 30 degrees in a clockwise direction and translated so the centroid is at (0, 0) is a matter of simply stacking these procedures together:-
>>>example = translate(base_section, -centroid.x, -centroid.y)
>>>example = rotate(example, -30, origin='centroid')
>>>pt = example.representative_point()
>>>print(pt)
POINT (-106.1274100070478 -9.380456945787259)
Graphically this looks as follows, and indeed as expected the point reported is inside the defined geometry:-
Anyway, I could go on and demonstrate 101 other things we could subject our poor little object to. But you probably get the idea, shapely makes what is required ahead of us on the geometry side of things extremely easy as opposed to writing our own (potentially slower) code to do these geometrical operations.
How can things possibly go wrong (apart from getting seriously sidetracked playing around)…
