Today we bring you moment, shear, deflection stuff! Sharing some basic VBA functions for determining the moment, shear and deflection of a simply supported beam (with or without cantilever) under almost any typical loading scenario imaginable.
Point loads, variable length uniformly distributed loads (constant, triangular, trapezoidal), etc [the only thing not implemented is a point moment, because it’s not that common in typical beam design… never needed it, not that practical].
I created these because I tend to start off working some weird loading out by hand using formulas instead of throwing it into some analysis program quickly, because I [falsely] thought it would be quicker by hand. I never learn.
But then the loading changes (made some error or multiple point loads, etc… go figure), or the span of the member changes (bloody architects usually), and by the time I’m finished it would have been quicker just to throw it into an analysis program and redo the analysis in an instant if things change.
Under weird load cases like triangular or trapezoidal cases when combined with point loads or constant UDL’s finding the maximum by hand is not that quick, so you’re almost forced to reach for an analysis program to get you to the end game.
Simplifying the end game..
Well, I finally got round to simply throwing something together in Excel so doing it by hand is much quicker than firing up an analysis program and plugging it in. The bonus is you can integrate it in any spreadsheet and use the output instead of manually transferring results from your black box program of choice to your spreadsheets.
I was knocking up some spreadsheets to design composite beams to the new AS/NZS2327 composite structures standard, and you really need more than a constant UDL if you’re serious about designing them correctly.
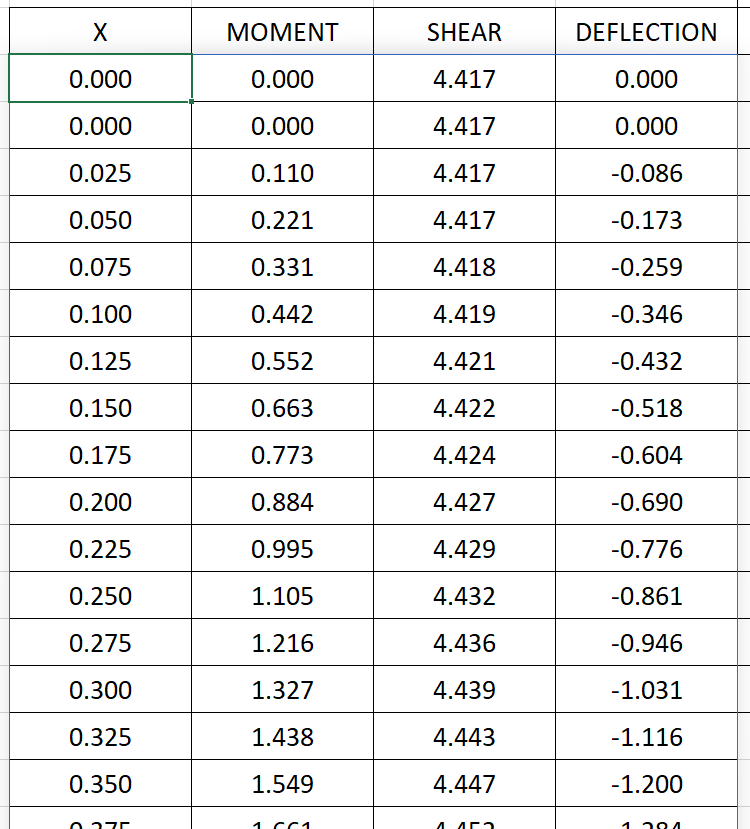
The modules are built with the plotting of results in mind to visualise the results, and to aid in extracting the min/max values if you calculate a sufficient number of points along your member. The results can be calculated at any ‘resolution’. By ‘resolution’ I mean the dimension step along the member at which you’re working out the design actions or deflections. Theres no solving for the absolute maximum, but if you divide a beam into 25mm chunks you’re going to get close enough for practical design. Theres virtually no overhead going to even smaller steps if you desire further accuracy.
So basically, the code create an array of values from beginning to end of the member at some specified regular intervals, like 0.1 meters or 0.00001 meters, up to you. Adds in the other points of interest at point load locations and the beginning and ends of the UDL loading and points some small distance either side of the point loads (to calculate & plot the step in the shear force diagram and accurate values at any discontinuities in UDL loading). Then these points of interest are run through modules for calculating moment, shear, deflection, and spit out some results as a dynamic array. Job done.
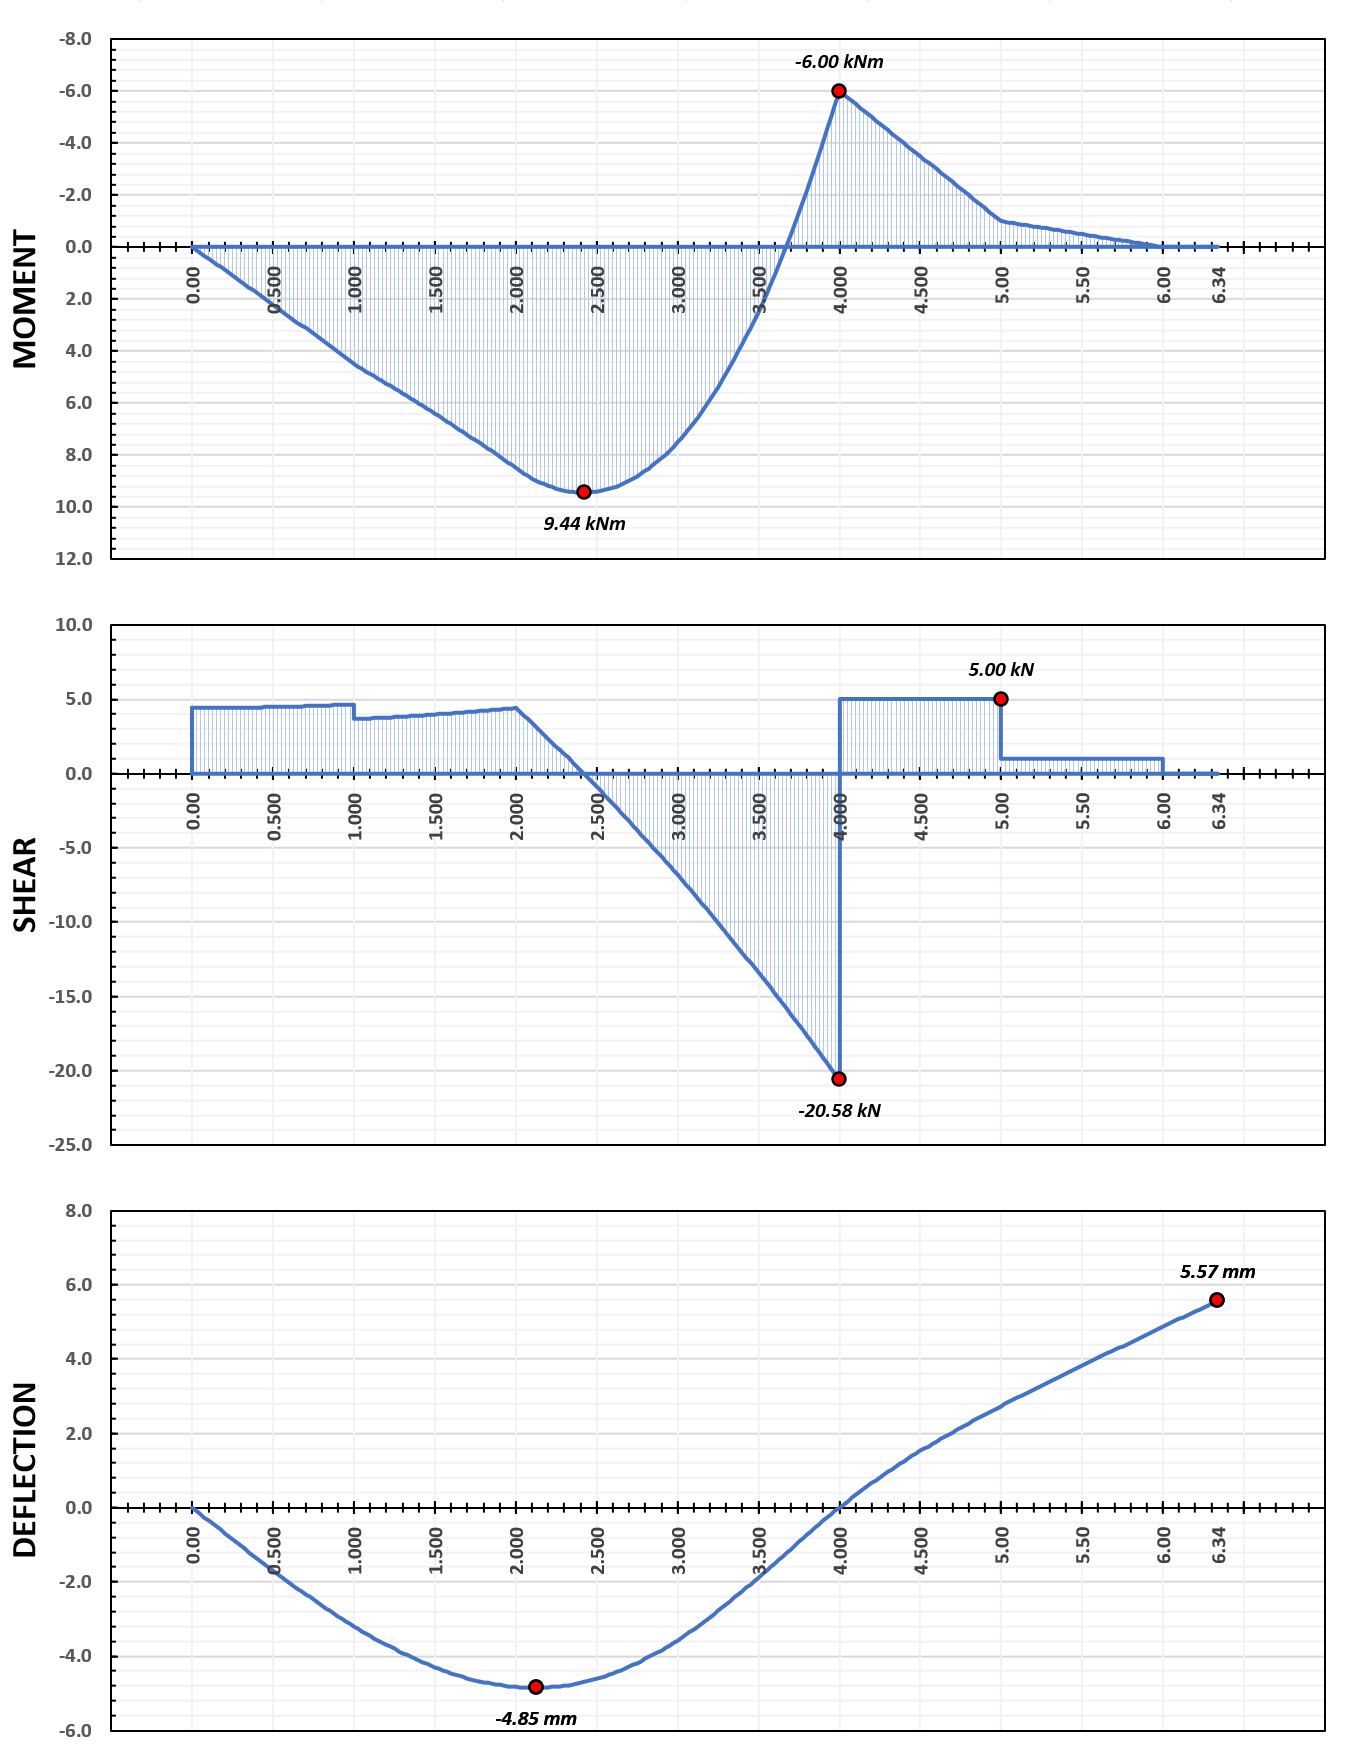
The end result is these moment, shear, and deflection plots (a 4.0m beam with 2.34m cantilever with some random loads):-
Loads are entered in a format of load and location arrays similar to shown below for UDL’s and point loads on main span and cantilever (if required), these form the inputs for the overarching BEAM_analysis function. The below configuration is setup for 3 UDL’s on both the main span and the cantilever span, and 3 point loads on the main span and the cantilever. You can specify any number of loads of any one type, just add more rows to the individual input arrays if required:-

So, with one function BEAM_analysis using the above inputs, you can get a dynamic array returned with the location, moment, shear and deflection for your given scenario! Easier than by hand.
Now that I’ve dangled the carrot, you’ll have to wait for part 2 where I’ll cover the functions and provide an example worksheet and Github repository. You can either copy the sheet into your own spreadsheets and/or start your own plots/layout of inputs from scratch. Over to you for the win.
Laters, until part 2 (sometime next week probably) …. UPDATE – Part 2 can be found here
Looked forward to part two to see how your solution method ends up comparing to how I approached the problem, I added a similar spreadsheet a few weeks ago to the Excel github repo for the open source group.
https://github.com/open-struct-engineer/Excel/blob/master/01-General%20Analysis/01%20-%20General_Beam_Analysis_MR.xlsm
I ended up not going the extra step and injecting additional plot points at the loads but instead maintained a constant sampling resolution and added in some functions to solve the max/min over a user specified location range. In hind sight it really bothers me seeing the shear diagram with a diagonal line at the point load location instead of the “vertical” line so wish I would have done that part your way here.
I added in a flexibility approach to allow for some internal support locations on the main span as well as allowing for fixed ends and implemented on-demand load factoring. I’m still looking for a better way to do the load combination enveloping vs just a straight brute force loop through each combo, I feel like there is a matrix method to be found here that I’ve just yet to see.
Hi DonB, I had a cursory look at your sheet, I’ve gone about returning the results on the sheet a little differently with the use of the dynamic array as an output. The calculations are a lot faster doing them all in VBA only calling a single function from the sheet rather than every cell calling a moment, shear, deflection, slope functions for each location along the beam. This allows you to scale the resolution for each step to anything you want as well as a bonus.
In my use case providing a step of say 25mm is close enough to just use a MAX() or MIN() or AGGREGATE() function on the individual columns on the results array to find maximums and minimums without solving for the actual true maximum or minimum. As they say, close enough for government work… :). Though I do like your approach of narrowing the band, might implements something similar as in my case it’s just filtering the results between some bounds (I already do this for the finding of max actions in cantilever and main span separately, but to narrow it further is a good approach). This is all on sheet stuff so the end user can implement things however they like I guess.
I agree regarding the vertical lines, which was one of the drivers in doing it this way to correctly pickup all the steps as near as possible to the true vertical step at point loads!