One thing to state up front, the shear, moment and deflection are all based on the loads given, so if they are factored ultimate loads then the moment, shear and deflection are factored. Which for the deflection might not be too helpful? Usually, you’ll want to know the deflection under a different case than the strength requirements.
But you can always use unscaled loads and scale the moment and shear appropriately afterwards and build up your own load combinations. I’ll modify the functions at some point to account for inputting load cases and scaling of dead and live and other loads separately. Not sure how that will pan out yet, but one day it might be sorted.
Onto the function…
The whole thing is driven by the overarching BEAM_analysis function, so there’s only a single function you need to really worry about. All the other functions are called from this module. As noted in part one, this function takes arrays or ranges of load values and locations, and other relevant beam properties. The inputs at the time of writing this post are outlined below: –
UPDATE – note in Part 3 of this series the code has been updated to include the addition of the consideration of point moments, so the inputs shown below have been updated accordingly.
=BEAM_analysis(length_step, L_main, L_cant, E_beam, I_beam, Main_UDL, Main_PT, Cant_UDL, Cant_PT, close_diagram, moment_shear_only)| length_step | The max distance step along the beam to derive the points at which results are to be returned |
| L_main | Main span beam length |
| L_cant | Cantilever span length |
| E_beam | Youngs modulus for the beam |
| I_beam | Moment of inertia of the beam |
| Main_UDL | Cell Range with UDL data for the main span |
| Main_PT | Cell Range with point load data for the main span |
| Cant_UDL | Cell Range with UDL data for the cantilever |
| Cant_PT | Cell Range with point load data for the cantilever |
| close_diagram | Optional Boolean value to add extra data points to close off moment and shear diagrams to allow for plotting. |
| moment_shear_only | Optional Boolean value to select only returning Moment and Shear |
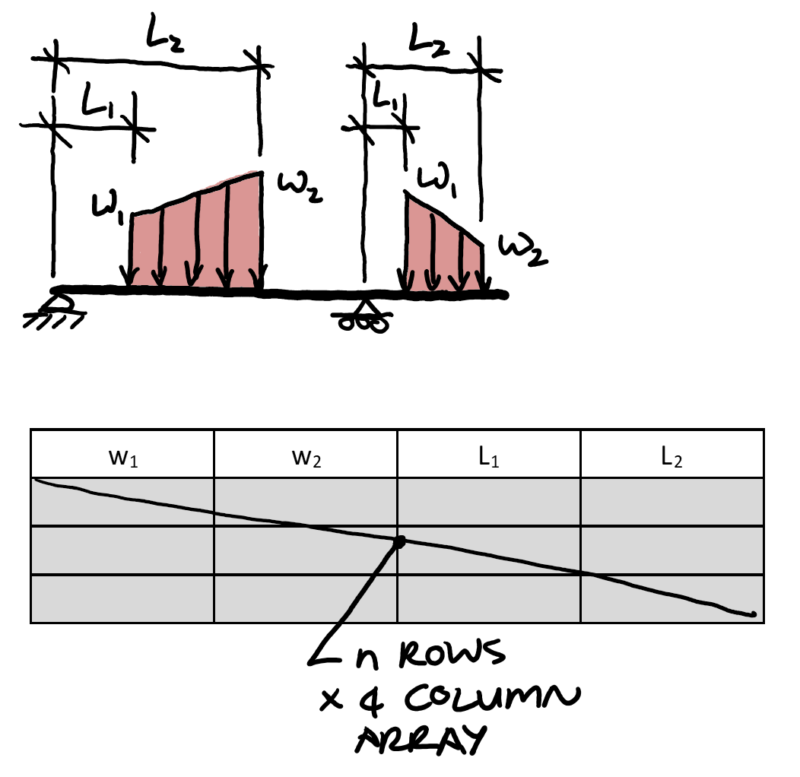
The UDL inputs (Main_UDL & Cant_UDL) are required to be in the following format: –
The point load or concentrated load inputs (Main_UDL & Cant_PT) are required to be in the following format: –
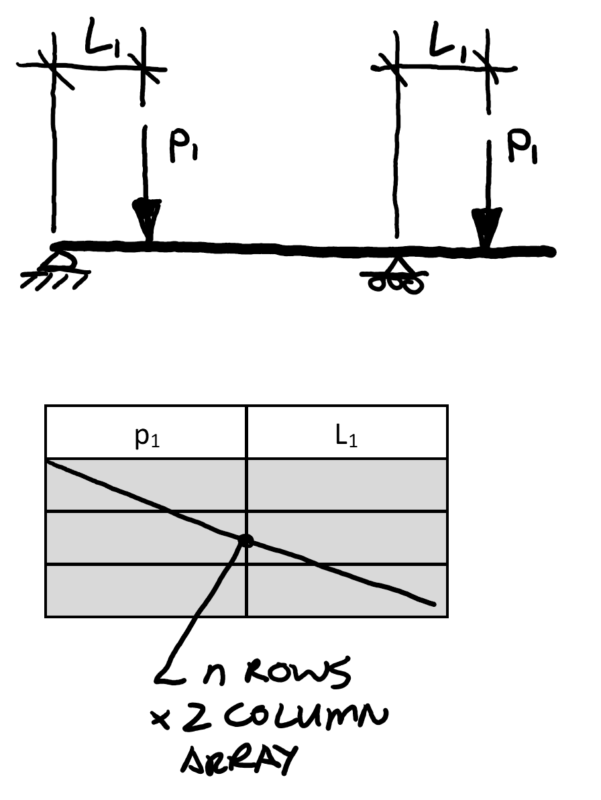
Loads acting downwards in the direction of gravity (as shown above) are negative in the applied sign convention.
All dimensions are entered in meters, all loads in kN or kN/m.
As noted in part 1, you can consider any number of individually defined loads, just add more rows, have 1000 point loads on a beam you need to urgently analyse, add 997 more rows and you’re good to go.
Blanks rows are ignored. Zero length UDL’s are ignored. Currently you need to specify all the inputs even if you’re not specifically using them, I’ll maybe look to change this somehow in the future. But the reality is if you setup your input sheet appropriately, then you always have all the load types on hand for the future.
Not that I’ve tried it (yet), but you can also call the functions from other VBA functions if you like to process multiple scenarios.
GitHub repository..
The GitHub repository can be found here with a module to import with the functions.
An example workbook can be found with some charts setup for moment, shear, and deflection. There plots have been customised a fair bit, adding labels in place of the normal axis labels, adding min/max points, and adding error bars to fake the shading under the plots for the moment and shear diagrams. Either import the VBA module to your own spreadsheets, or simply copy or move the entire worksheet to your own spreadsheet along with importing the Beam_formulae.bas module and modify from there.
There also a small VBA module in the sheet1 module you can use to set all three plots to the same size & set out. Modify to suit your particular situation.
Conclusion
Hopefully the code and spreadsheet saves some time setting up your own spreadsheets with some nice-looking moment, shear and deflection plots, without having to bother with creating these plots and the underlying analysis each time from scratch.
Enjoy.
In part 3 we’ve added point moments….