One thing that irks me about a lot of spreadsheets I’ve seen created over the years is the fact that the inputs for something that can be visualised are hidden behind a few numbers in cells. No visual representations of the calculations are given. With an overarching reliance on the user to mentally complete the picture of their design inputs (and sometimes outputs) within their minds.
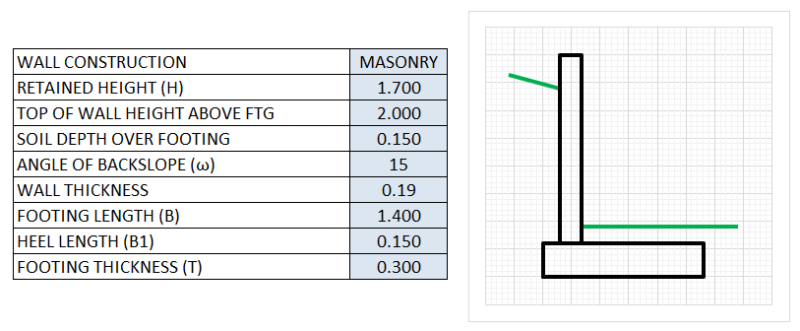
For example say you’re designing a retaining wall and inadvertently get one input on the geometry wrong. Maybe it’s simply transposing some numbers, an incorrect decimal place or something else you don’t really notice. If the answers seem in the ballpark you maybe don’t question it any further, and you’re none the wiser regarding your error.
Now if you have a visual output visualising the wall geometry (a picture for the non-engineers?), aren’t you more likely to spot your error, especially if it’s significant!?
Often the use of “engineering judgement” in the structural engineering profession is based on something not quite looking right, or just a feeling of something not being quite right. With a picture staring you in the damn face outlining your mistake your engineering judgement gets a welcome boost in terms of something looking right.
So why on earth isn’t it done more then in spreadsheets? Even some commercial software is guilty of death by screeds of numbers, when a nice picture representing the inputs and/or outputs would tell the same (or better) story.
I’m not talking here about cutting and pasting a cross section of a generic retaining wall (though that does help with the interpretation of inputs). I’m instead talking about raising your Excel game and creating for this theoretical example a chart in Excel to show the exact geometry of the retaining wall based on your inputs. Engineer 1 vs Sheep 0!
This is basically better….
….than this when it comes to noticing subtle input errors….
Charts in Excel are an incredibly powerful tool, I use them regularly to visually represent inputs or outputs in spreadsheets.
Lately I had to do an exercise where I needed to work out exact contents of reinforcement in various reinforced concrete members, this involved needing to work out the exact lengths of stirrups and links. This is something that is usually palmed off to some unsuspecting quantity surveyor without realising it, but in this case I was that chump for some reason.
I started doing this task by hand and after about half a page of writing some calculations I thought there must be a way to automate this! Otherwise I was thinking it’s just going to take ages or more importantly be a whole lot less accurate, more prone to error and frankly a whole lot more boring!
So I cobbled together a few VBA routines based on entering the centerline dimensions of the bars which stirrups went round, bar diameters and a few other properties, and the functions output the exact length of the bar required to make up that stirrup or link. Job done with a few formulas on a sheet, much more accurate and scalable than doing the exercise by hand.
As an aside one thing that did surprise me in doing this exercise that I’d never thought of before, was the sheer weight of steel that goes into the shear reinforcement. Engineers (well maybe just me?) become fixated on primarily optimising the longitudinal reinforcement.
While the shear reinforcement can equate to a large percentage of the total reinforcement, in the cases of the heavily reinforced members I was looking at, the shear reinforcement was over 50% of the total. But this seems to get a lot less scrutiny as far as optimisation goes. All those bends, overlaps and small extensions really do add up instead of just comparing a rectangle approximating a stirrup, my spreadsheet says so ;).
Maybe it’s the fear of brittle shear failures occurring vs ductile flexural failures, subconsciously causing me not to care quite so much if the shear reinforcement is not shaved down to the bones. However, unsure if I’ll change my ways, but at least now I’m aware of the error of my ways.
This particular exercise got me thinking that having worked out many VBA routines for determining minimum bend radii, standard hook extensions and the like in accordance with my local concrete code NZS3101. Then actually generating some geometry for these bar elements and plotting them was a short exercise and meant I was only a step away from Excel glory.
Enhancing many of my spreadsheets with near perfect representations of a cross section complete with main bars and shear reinforcement! Easy!
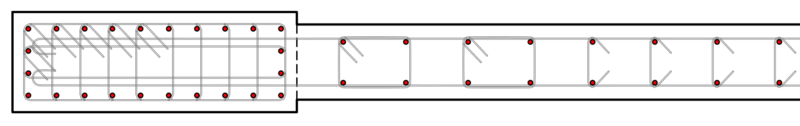
Basically one user defined function (UDF) in Excel generates the following examples:-
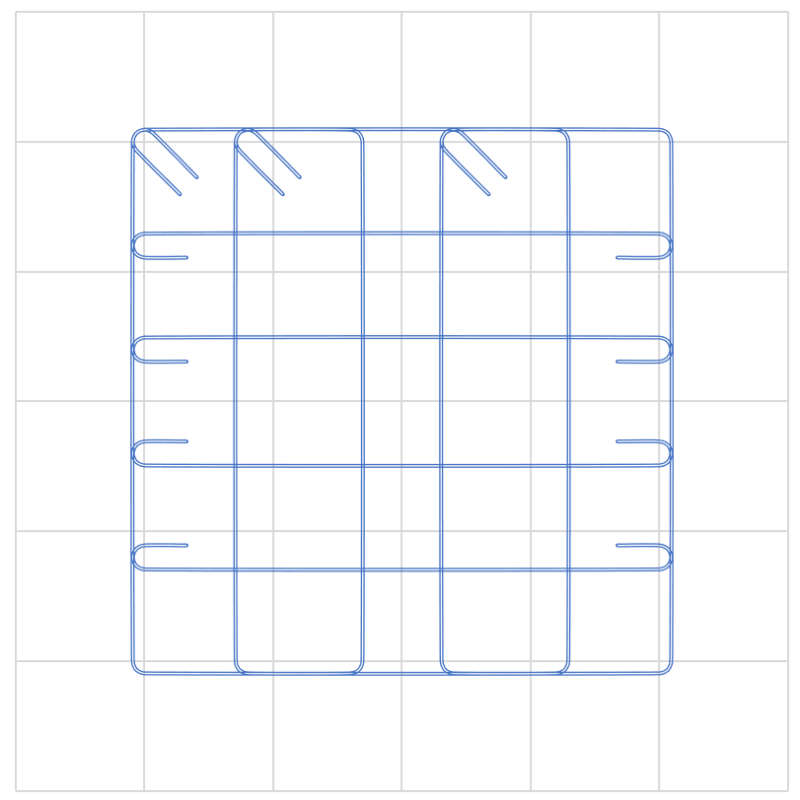
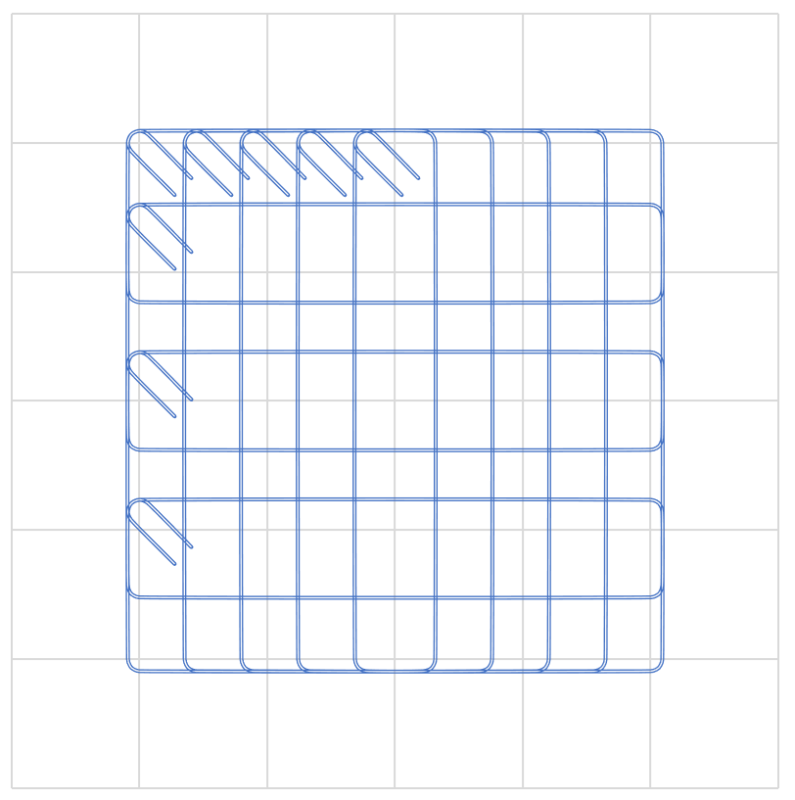
With some additional VBA or on sheet formulas you can create some awesome representations of your design, all to scale and instantly updated to reflect your design changes. For example, the end region of a wall: –
So this is really what this series of posts is about. Sorry if you got excited about retaining walls earlier on…. you probably need some professional counseling or something if you find that sort of thing exciting…. Just saying….
I’m sharing these routines in the hope that someone else can use them to create their own version of Excel awesome (and working out the boring bits as well regarding bar lengths if you ever have the misfortune to play quantity surveyor for a day).
Part 2 in the series will go over the routines in detail. Until then, stay frosty.